
Organize, Explore, Analyze – Built for Plant Breeding
This powerful data visualization platform is specialized for use cases in plant breeding. Load, organize, explore and analyze all of your data on one platform. Filter and breakout data, run head-to-head comparisons and create meaningful plots to inform your breeding decisions faster and more accurately than ever before.
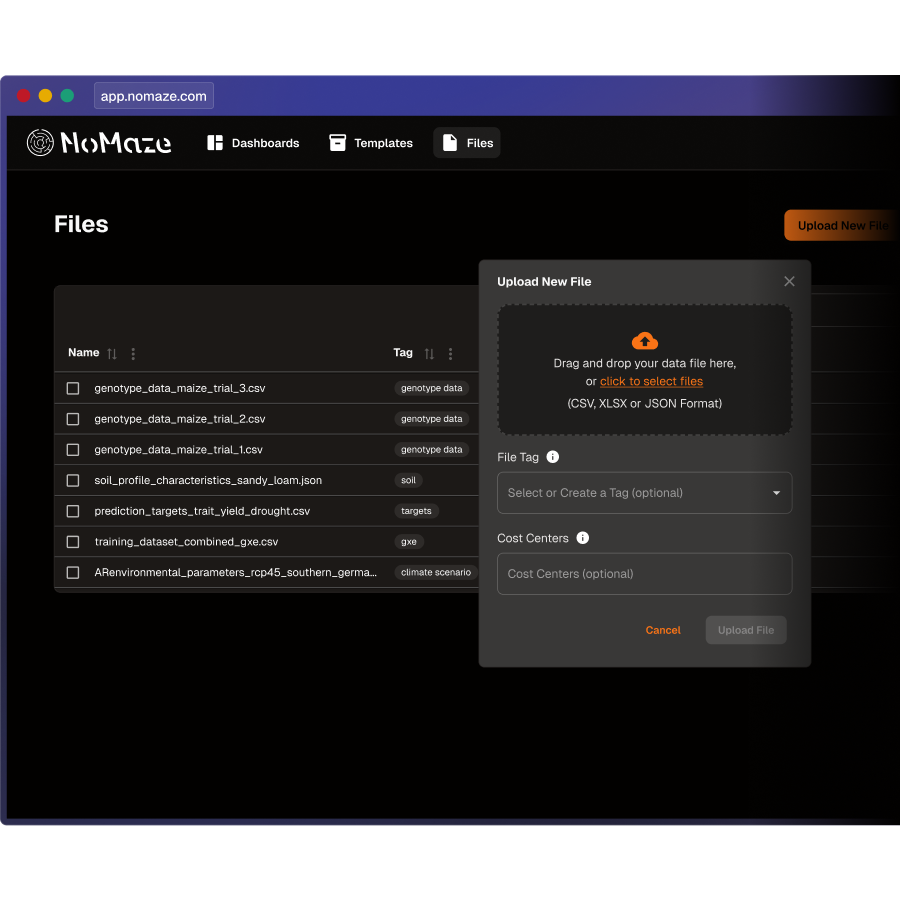
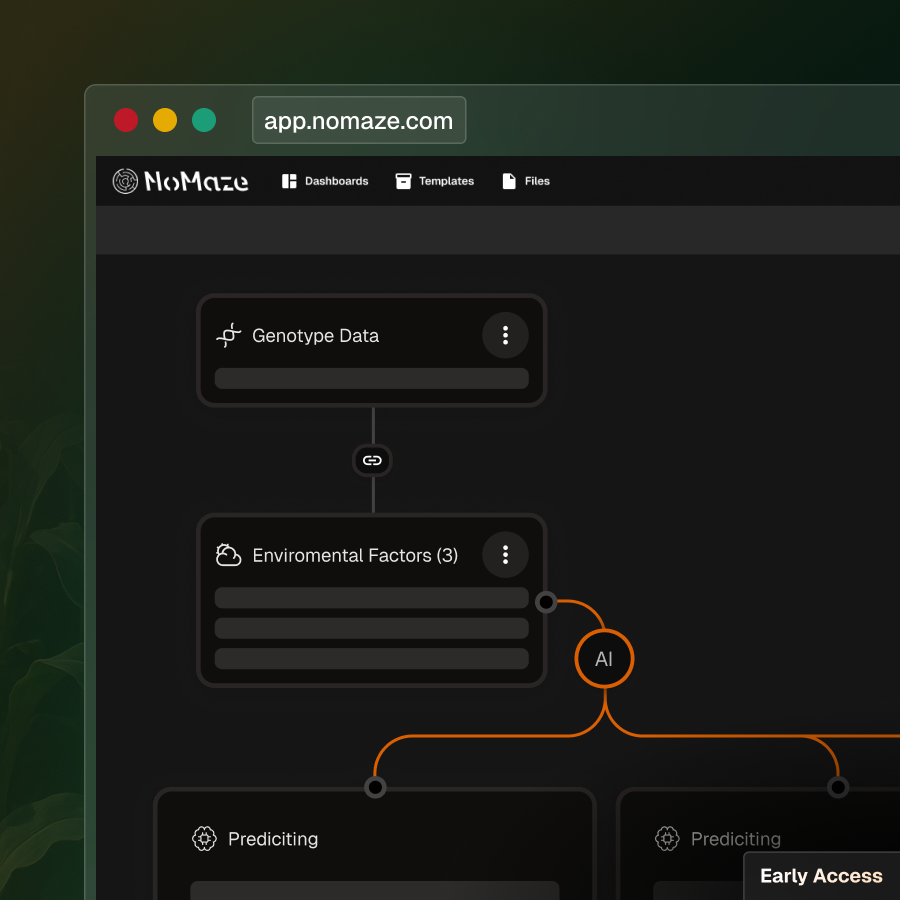
Organize All Your Data
SmartPlot enables researchers and breeders to efficiently manage, organize, and orchestrate complex phenotypic and genotypic datasets. SmartPlot provides intuitive, interactive visual interfaces to streamline data exploration, uncover patterns across environments and traits, and facilitate informed decision-making throughout the breeding cycle.
Upload data sources in various formats and store them securely for easy access, management, and reuse.
Organize data in different pipelines and keep track using flexible file tagging for better structure and traceability.
Share dashboards with your team and let them iterate collaboratively on shared templates and visual insights.
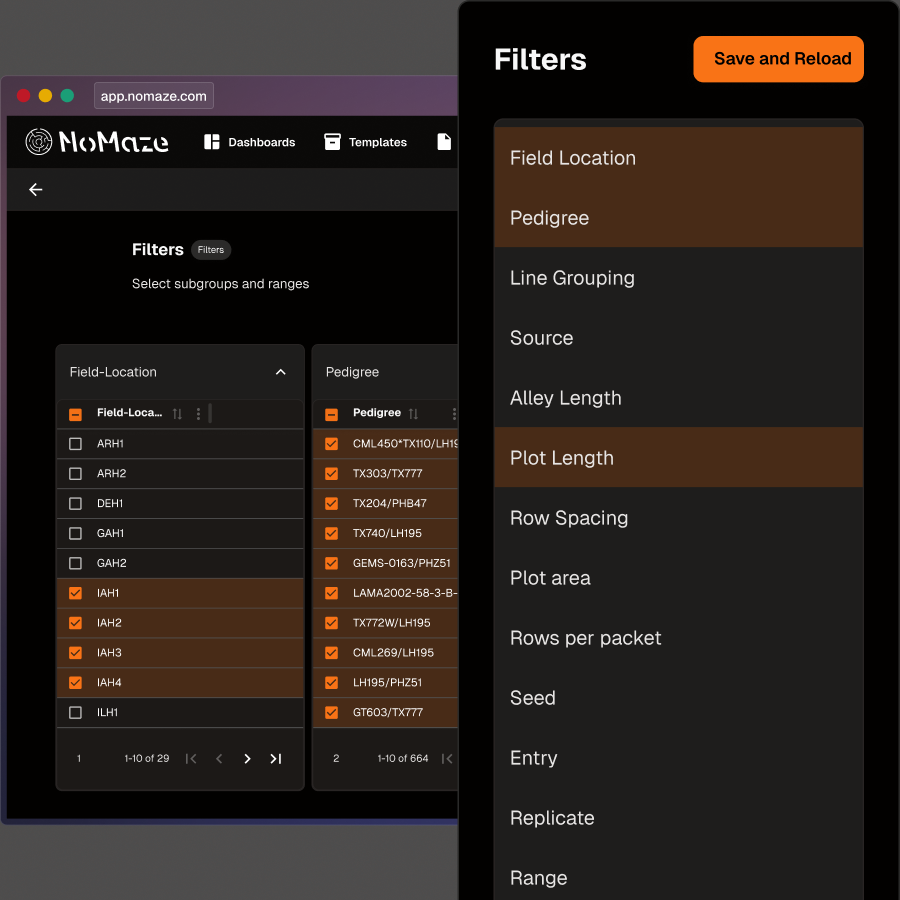
Filter And Refine Your Breeding Pipeline
SmartPlot allows you to effortlessly filter and slice through diverse datasets — like field location, pedigree, yield or weather data - so you can quickly isolate and focus on the specific information most relevant to your breeding decisions.
Quickly zoom in on the data you care about most using powerful, flexible filtering options for precision.
Preview datasets instantly with quick statistics for immediate insight into structure and content.
Select columns and filter values within them to explore and refine your dataset with precision.
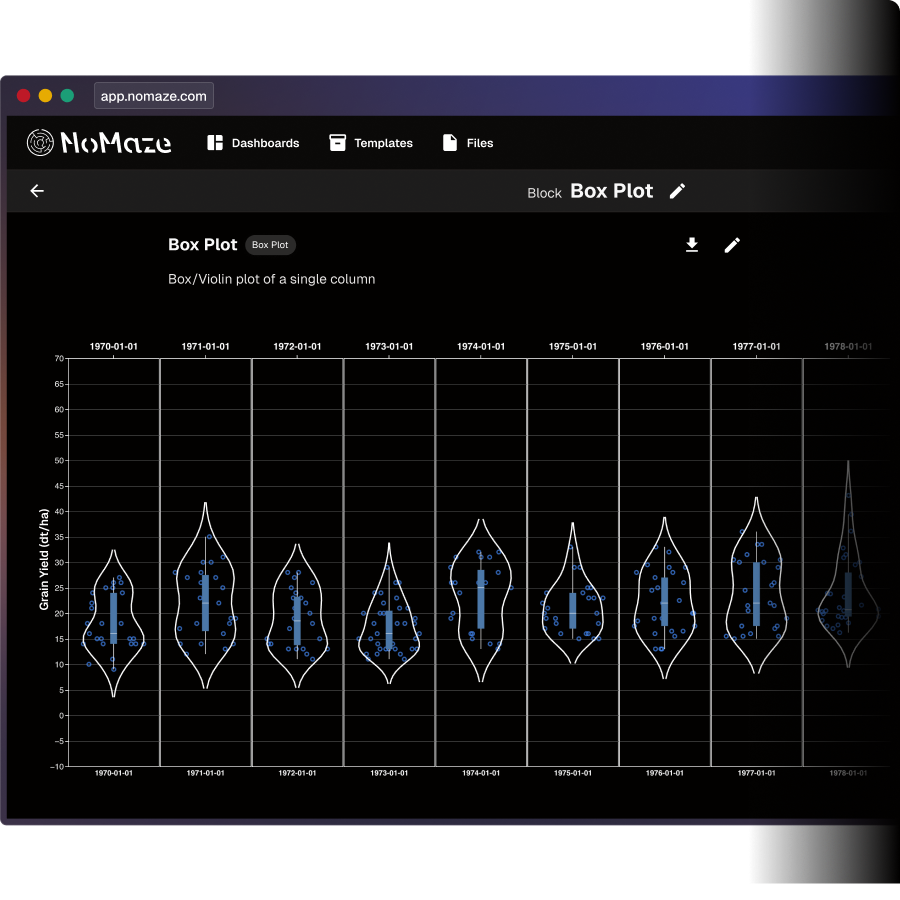
Visualize Your Data In Advanced Plots, Build H2H Comparisons And Perform Data Splits.
Visualize your breeding data with advanced, customizable plots. Effortlessly build head-to-head comparisons and apply flexible data splits to uncover meaningful patterns, compare genotypes, and support informed decisions across traits, environments, and breeding stages.
Reveal insights – spot trends and outliers across traits, genotypes, and environments.
Compare genotypes – H2H plots highlight performance differences in specific conditions.
Focus decisions – split data by season, location, or stage for sharper analysis.
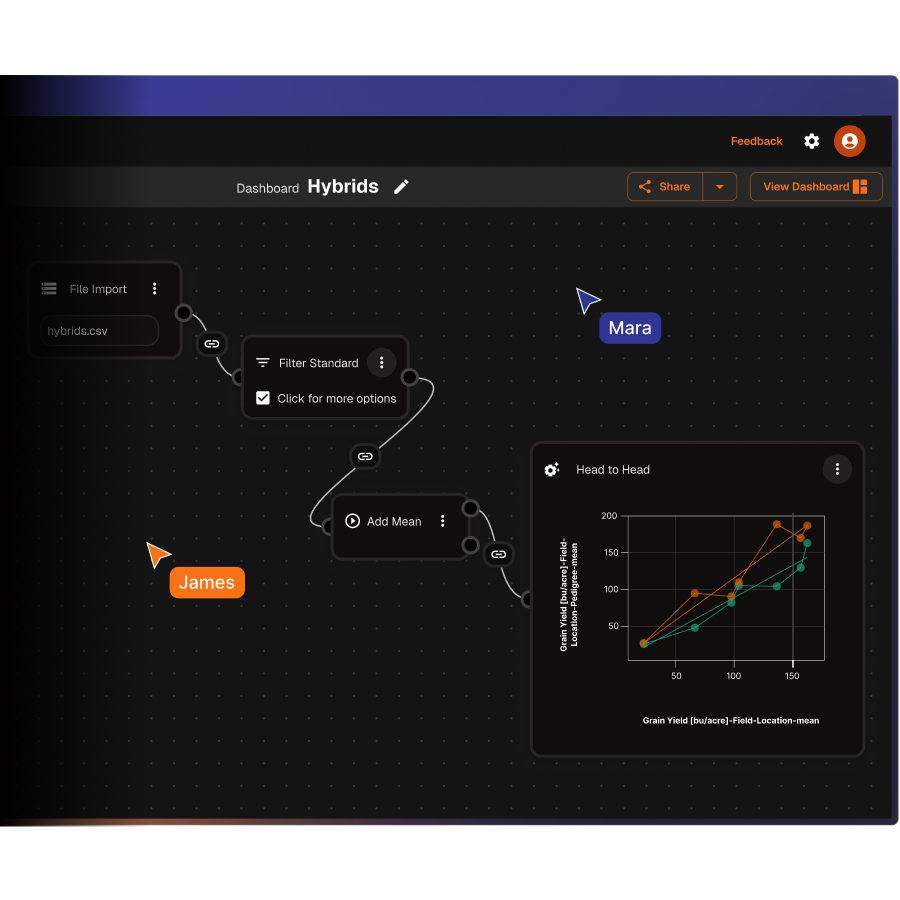
Collaborate and Share Insights With Your Team
SmartPlot lets you effortlessly filter and explore datasets — such as location, pedigree, yield, or weather data - so you can quickly isolate and focus on the specific information most relevant to your breeding decisions.
Quickly zoom in on the data you care about most using powerful, flexible filtering options for precision.
Preview the dataset at first glance using quick statistics for immediate insight into structure and content.
Select columns and filter values within them to explore and refine your dataset with precision.
SmartPlot Integrates With Agronomix
With built-in integration and intuitive tools, SmartPlot simplifies complex data handling, letting you focus on interpretation, discovery, and decision-making.
Essential Tools For Breeding Pipelines
Essential tools to streamline, optimize, and accelerate every stage of your breeding pipeline.
Import data sources easily from multiple formats to centralize, standardize, and streamline your breeding data workflow.
Perform Statistical Analysis
Perform statistical analysis to uncover trends, relationships, and significance, guiding data-driven breeding decisions.
Filter Data Efficiently
Filter data efficiently to quickly isolate relevant information, improve analysis accuracy, and enhance decision-making.
Use Box Plots, Histograms, and Scatter Plots
Build box plots, histograms, and scatter plots to visualize data distributions, relationships, and identify outliers effectively.
Show Correlations and H2H Comparisons
Show Correlations and H2H Comparisons to Reveal Trait Relationships and Compare Genotypes Effectively.
Share Data Securely and Collaborate with Your Team.
Share Data Securely and Collaborate Seamlessly with Your Team.

"Our partnership with NoMaze shows what happens when breeding expertise and technology truly come together. It helps our teams work with data more intuitively and make quicker, more confident decisions, all in service of developing better seeds for farmers."

Deploy Smart: Cloud, On-Premise Or API
Our platform supports your technical setup and governance standards—so you stay compliant and in control.
Easily deploy our platform in your own IT-infrastructure with full control, flexibility, security, and governance.
Use our proven cloud environment and benefit from maximum scalability, flexibility, reliability, and performance.
Deploy consistently across different environments, tailored to your specific requirements and operational needs.
Visualize and Predict: SmartPlot Pairs With TraitLens
TraitLens
Capture the complexity of GxE with Predictive AI. Test environments through early breeding programs. Optimize field tests through better pre-selection. Optimize yield alongside phenotypic traits.
Visualize Breeding Success
– Start With SmartPlot
Get in touch and start using cutting-edge AI technology trusted by top breeding teams worldwide.